Celebrating 20 years of NVDA!
Yippee! NVDA, the free and open source Windows screen reader, has been in development for 20 years now! Read on to learn about the development history of NVDA and the huge community that has grown with it.
On top of this massive milestone, NVDA has now been on GitHub for 10 years. GitHub is the platform where NVDA development occurs, it’s where you can report issues, contribute features, and discuss development. During our time on GitHub, NVDA has grown from a small open-source screen reader into a global community effort supported by volunteers, contributors, and NV Access.
This report provides an overview of how the NVDA project has evolved over the past 15 years of tracked data. It explains how we manage bug reports (“issues”), how new code changes are proposed (“pull requests”), and how our security processes have matured. More importantly, it highlights the people and systems behind NVDA’s growth: showing how community engagement, improved processes, and NV Access staffing have helped NVDA development remain responsive, stable, and secure.
Typically an NVDA issue will go from being opened to being “triaged” (i.e. reviewed and confirmed). Then a community member or NV Access will open a pull request to close the issue. The pull request will be reviewed by NV Access and the community. When the request is approved the issue will be closed, the code will be merged, and released in the next version of NVDA.
Overall, we’ve seen steady year on year growth of code changes from both the community and NV Access. This has resulted in largely staying on top of issues, with issues older than 2016 having a 95% closure rate, and issues from 2016-2023 having an 80% closure rate. Since a high of 2500+ open issues a few years ago, NVDA now has about 2100 open issues. Improvements to our issue triage, pull request review and security processes have had measurable results.
The NVDA contributor community is made up of hundreds of volunteers including translators, developers, testers, issue investigators and issue reporters. Community members have volunteered half of our code contributions, reported thousands of issues, and helped investigate those issues. As of 2025, NVDA has several community bodies driving development. There is an advisory group of trusted community members providing advice to NV Access, a security advisory group dedicated to security research, our GitHub community and various community email lists.
Quick Facts
- ~2100 open issues, ~12,000 closed issues, 85% closure rate
- 46% of open issues have been accepted and are ready to be worked on
- 700+ issues opened each year
- ~700 code contributions a year and steadily growing
- 50% of all code contributions come from the community
- 87% of all proposed code contributions have been accepted into NVDA
- 30+ active community code contributors in 2025
- 73 active translators in 2025
- 1.4 million words translated in 2025
- 20 published security advisories since 2022
How We Manage and Resolve Reported Issues
Issues are how we track bug reports, feature requests and other work for NVDA.
In 2009, the NVDA project first started accepting issue reports on an issue tracking service called Trac.
In 2015, NVDA moved to GitHub, and issues were copied over.
In 2022, NV Access began formally triaging all new issues. This is a process of going through all recently opened issues and:
- ensuring the report is valid
- ensure the report contains enough information for a developer to work on it
- adding information to help progress the issue
- assigning a priority to the issue
In 2025, NVDA adopted GitHub’s issue form feature, a more beginner friendly way to report issues.
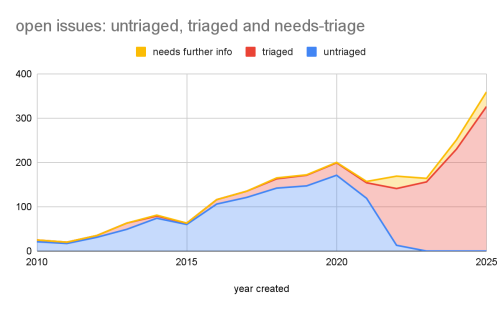
If an issue is accepted and ready for work from either the community or NV Access, the “triaged” label is applied. Otherwise “needs-triage” is applied to issues that need further information. Triaging an issue helps progress it towards completion, and signals to the community that it is ready to be fixed. An issue is then closed when it is fixed, or no longer valid.
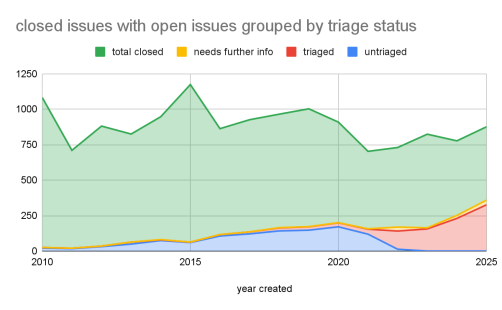
The NVDA project consistently gets 700-1000 issues created per year. NVDA had an all time low in 2021 of 700, and an all time high in 2015 of 1200. Since the low of 2021, issue creation has been slowly increasing. Before 2021, issues created per year varied without consistency.
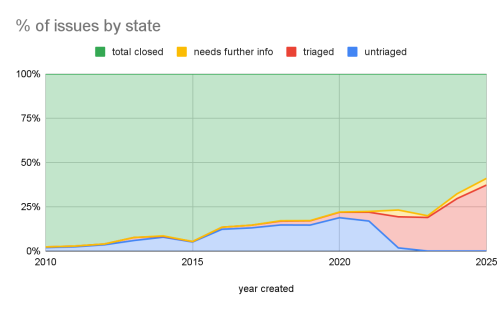
The older an issue is, the more likely it is to be closed. 95% of the issues opened before GitHub, i.e. older than 2016 are closed. Triaging issues also seem to improve closure rate, as our highest closure rate of the past 6 years (80%), and our highest triage rate (95%) both occurred in 2023.
Issue Data
Note issues from 2007-2010 are grouped due to migrating from Trac to GitHub.
Data Tables
| year created | untriaged | triaged | needs further info | total open | total closed | % closed | % triaged |
|---|---|---|---|---|---|---|---|
| 2007-2010 | 21 | 4 | 0 | 25 | 1057 | 97.69% | 16.00% |
| 2011 | 17 | 3 | 0 | 20 | 690 | 97.18% | 15.00% |
| 2012 | 31 | 4 | 0 | 35 | 846 | 96.03% | 11.43% |
| 2013 | 49 | 14 | 0 | 63 | 762 | 92.36% | 22.22% |
| 2014 | 74 | 5 | 2 | 81 | 866 | 91.45% | 6.17% |
| 2015 | 60 | 3 | 0 | 63 | 1111 | 94.63% | 4.76% |
| 2016 | 106 | 10 | 0 | 116 | 747 | 86.56% | 8.62% |
| 2017 | 121 | 14 | 0 | 135 | 791 | 85.42% | 10.37% |
| 2018 | 142 | 21 | 2 | 165 | 800 | 82.90% | 12.73% |
| 2019 | 147 | 24 | 1 | 172 | 831 | 82.85% | 13.95% |
| 2020 | 171 | 28 | 1 | 200 | 709 | 78.00% | 14.00% |
| 2021 | 119 | 35 | 3 | 157 | 546 | 77.67% | 22.29% |
| 2022 | 13 | 128 | 28 | 169 | 561 | 76.85% | 75.74% |
| 2023 | 0 | 156 | 8 | 164 | 660 | 80.10% | 95.12% |
| 2024 | 0 | 230 | 21 | 251 | 526 | 67.70% | 91.63% |
| 2025 | 0 | 326 | 33 | 359 | 517 | 59.02% | 90.81% |
| Total | 1071 | 1005 | 99 | 2175 | 12020 | 84.68% | 46.21% |
Charts
 Data Sources
- Triaged issues by year
- Issues which need further triage information by year
- Untriaged issues by year
How NVDA’s Community Contributes Code
A pull request (PR) is the term for a proposed code change. To make a change to NVDA, such as adding a feature or fixing a bug, NV Access and community members will begin work by creating a pull request. The pull request will then be reviewed by NV Access, and usually the community too, before being incorporated into NVDA.
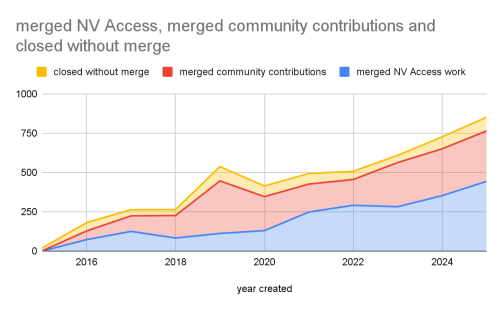
NVDA is truly made by the community! Since 2015 about 50% of all changes to NVDA have come from community members. Year on year, pull requests continue to grow thanks to growth in the community and NV Access. Each year, the number of total PRs increases by about 50, with 700 contributions in 2025.
In 2015, after moving to GitHub, NVDA started accepting community code contributions via pull requests. In 2016, NV Access hired its first full-time software developer and in 2021, NV Access hired another developer. In 2023, NV Access was briefly down a full-time developer, hiring again in 2024.
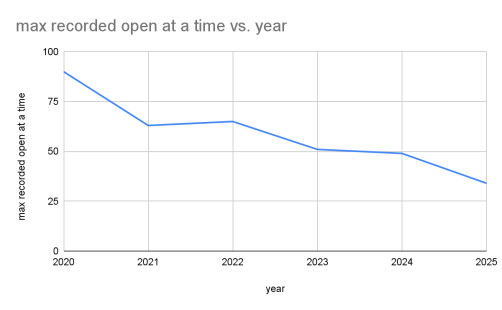
After an all-time high of 334 community pull requests in 2019, NV Access started tracking how many PRs were open each week. This was due to a large amount of community contributions waiting on feedback or support from NV Access. Many of these pull requests were part of a major update of the underlying programming language NVDA is written in; going from Python 2 to Python 3. In 2020 there were over 90 open pull requests, in 2025 we had an all time low of 7 open, and a max of 34 open PRs at a time. This means that now when a PR is opened, it receives prompt attention, and time is minimised from the start of work, to being available in NVDA.
From 2020-2021, to catch up with the back log of community contributions, NV Access only accepted community PRs that were bug fixes, and stopped accepting new features from the community. Since reducing the back log and the subsequent re-opening of feature additions from the community, community PRs have risen year on year up to 321 in 2025.
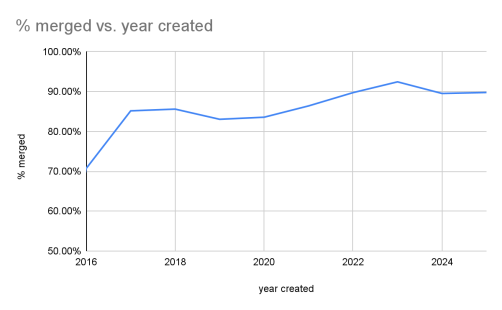
Sometimes, PRs are closed without being added (merged) into NVDA. This could be due to the implementation not working correctly, a new PR being opened to replace it, or the work being abandoned. Overall, 87% of PRs have been accepted and merged. This means that generally when work has started on something, there’s a good chance it gets finished and becomes part of NVDA. This has improved over time, and now is about 90% each year.
Pull Request Data
Data tables
| year created | max in progress at a time | merged NV Access work | merged community contributions | total merged | closed without merge | total closed | % community contributions | % merged |
|---|---|---|---|---|---|---|---|---|
| 2015 | 0 | 2 | 2 | 18 | 20 | 100.00% | 10.00% | |
| 2016 | 73 | 55 | 128 | 53 | 181 | 42.97% | 70.72% | |
| 2017 | 125 | 99 | 224 | 39 | 263 | 44.20% | 85.17% | |
| 2018 | 83 | 143 | 226 | 38 | 264 | 63.27% | 85.61% | |
| 2019 | 112 | 334 | 446 | 91 | 537 | 74.89% | 83.05% | |
| 2020 | 90+ | 130 | 216 | 346 | 68 | 414 | 62.43% | 83.57% |
| 2021 | 63 | 248 | 178 | 426 | 67 | 493 | 41.78% | 86.41% |
| 2022 | 65 | 291 | 164 | 455 | 52 | 507 | 36.04% | 89.74% |
| 2023 | 51 | 282 | 281 | 563 | 46 | 609 | 49.91% | 92.45% |
| 2024 | 49 | 352 | 298 | 650 | 76 | 726 | 45.85% | 89.53% |
| 2025 | 34 | 443 | 321 | 764 | 87 | 851 | 42.02% | 89.78% |
| Total | 90+ | 2110 | 2091 | 4201 | 628 | 4786 | 49.77% | 87.78% |
Charts
Data sources
Improving NVDA’s Security Through Better Reporting
In 2022, NV Access created a formal security issue handling policy and enabled GitHub’s Security Advisories feature. This made it easier for researchers and developers to report vulnerabilities responsibly. A total of 20 published advisories have been recorded since 2022. On average, NV Access will release a fix to a stable version of NVDA within 3 months of a security issue being reported. Over half of security issues were fixed in under 1 month, with more complex security issues increasing our average response time.
Security Advisory Timeline:
- 2022: 14 published advisories created
- 2023: 0 published advisories created
- 2024: 3 published advisories created
- 2025: 3 published advisories created
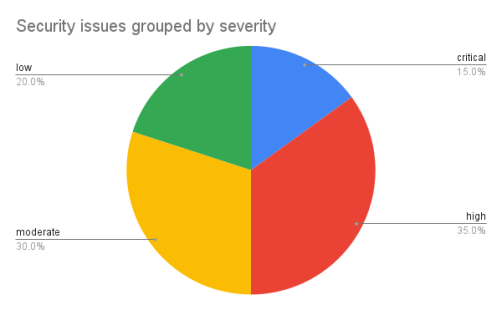
Severity Levels:
- Critical: 3 (15%)
- High: 7 (35%)
- Moderate: 6 (30%)
- Low: 4 (20%)
What do more advisories actually mean? More reports do not mean NVDA is becoming less secure. Instead, it means:
- The community is paying closer attention
- Our responsible disclosure policy is working
- NVDA is improving its security each year
Security Advisory Data
- Average (mean) days from report to fix released: 91
- Median days from report to fix released: 25.5
| year created | published | critical | high | moderate | low |
|---|---|---|---|---|---|
| 2022 | 14 | 3 | 4 | 6 | 1 |
| 2023 | 0 | 0 | 0 | 0 | 0 |
| 2024 | 3 | 0 | 3 | 0 | 0 |
| 2025 | 3 | 0 | 0 | 0 | 3 |
| Total | 20 | 3 | 7 | 6 | 4 |
Data source: Security Advisories
Making NVDA available to the whole world
NVDA is actively translated to 67 languages. Volunteer translators from across the world translate the NVDA interface, user guide and change log.
In late 2024, NVDA migrated to Crowdin for translations, from a custom legacy system.
In 2025, 1.4 million words were translated by 73 active translators to 67 languages. That’s an average of 19,000 words per translator per year.
Further work to do
This report shows how improving our processes can have a positive effect on the entire NVDA development pipeline. We intend to continue to improve the end-to-end process: from reporting an issue, to triaging it, to the pull request which fixes it. By triaging older issues, we can unblock work that has been requested for over a decade. We also want to continue to train and encourage new contributors, to help grow the community. To do this, we can improve developer documentation, developer tools and direct mentorship. With the PR backlog reduced, we can keep on top of new community code contributions in a responsive manner.
Please consider contributing to NVDA by reading our contributors guide. There are several ways in which you can contribute to the NVDA project: